data visualization
 48:39
4 2 1 Christopher Domas The future of RE Dynamic Binary Visualization
59K views • 14 years ago
Adrian Crenshaw
Christopher Domas presents his Cantor Dust tool at Derbycon 2012, a 3D visual approach to reverse engineering binaries by visualizing their structure dynamically.
 1:03:22
REcon 2013 - The Future of RE : Dynamic Binary Visualization (Christopher Domas)
9K views • 12 years ago
Sébastien Duquette
Christopher Domas's REcon 2013 talk on dynamic binary visualization for reverse engineering. He shows how rendering binary data as interactive visual maps and trigraphs reveals structure that hex dumps hide, leading to his Cantor.dust tool.
 35:16
Bret Victor - Drawing Dynamic Visualizations
17K views • 11 years ago
Colin McDonnell
Bret Victor's talk on Drawing Dynamic Visualizations. It argues that visualization tools offer either the directness of hand drawing or the dynamics of programmed graphics, and shows a tool that combines both.
 14:48
Sonification & The Problem with Making Music from Data
259K views • 9 years ago
Tantacrul
Tantacrul examines sonification, the practice of turning data into sound or music, and critiques how scientists and musicians, including NASA and CERN projects, use it well and poorly.
 55:10
Visualizing Data Using t-SNE
204K views • 13 years ago
Google TechTalks
A Google Tech Talk by Laurens van der Maaten, co-creator of t-SNE, on visualizing high-dimensional data by mapping it to two dimensions. It explains how the technique works and how it compares with other visualization approaches.
 3:54
Deep Visualization Toolbox
270K views • 11 years ago
Jason Yosinski
A short demo of the Deep Visualization Toolbox, which shows the activations inside a convolutional neural network as it processes live camera input. Viewers see individual units responding to edges, faces and text.
 4:58
Most Popular Programming Languages 1965 - 2019
7.2M views • 7 years ago
Data Is Beautiful
An animated ranking of the most popular programming languages from 1965 to 2019, built from popularity indexes, GitHub access data and historical surveys.
Topic match · Data visualization & information design 3:11
NASA | A Year in the Life of Earth's CO2
4.9M views • 11 years ago
NASA Goddard
A short NASA Goddard visualization from the GEOS-5 model showing a year of atmospheric carbon dioxide moving around the globe. It shows plumes from sources, hemispheric differences and seasonal swings as plants grow and die back.
Topic match · Data visualization & information design 1:06:44
01 - Course Introduction & Relational Model (CMU Databases Systems / Fall 2019)
248K views • 7 years ago
CMU Database Group
The first lecture of Andy Pavlo's CMU 15-445 Intro to Database Systems (Fall 2019), covering course introduction and the relational model.
 6:08
Immigration, World Poverty and Gumballs
6.8M views • 16 years ago
NumbersUSA
Roy Beck's short gumball presentation using World Bank and Census data to argue that letting people immigrate to the US cannot solve world poverty because the numbers are so large. It is made by NumbersUSA, an immigration-restriction advocacy group.
Topic match · Data visualization & information design 10:16
Hans Rosling: Global population growth, box by box
1.9M views • 16 years ago
TED
Hans Rosling's TED@Cannes talk uses boxes and animated data graphics to show how world population will grow to about 9 billion. He argues that raising living standards for the poorest is what reduces population growth.
Topic match · Data visualization & information design 11:42
See how the rest of the world lives, organized by income | Anna Rosling Rönnlund
881K views • 8 years ago
TED
Anna Rosling Rönnlund presents Dollar Street, a project photographing homes in dozens of countries, from stoves to beds to toilets, and sorting them by income. She shows how data visualization can change how we see the world.
Topic match · Data visualization & information design 10:00
Nuclear Detonation Timeline "1945-1998"
1.2M views • 16 years ago
Don't Blink
A timeline visualization plotting the 2053 nuclear tests and detonations from 1945 to 1998 on a world map, with sound marking each blast. It conveys the pace of the nuclear arms race.
Topic match · Data visualization & information design 1:54:11
James Powell: So you want to be a Python expert? | PyData Seattle 2017
508K views • 9 years ago
PyData
James Powell's nearly two-hour PyData talk builds up Python's data model, decorators, generators and context managers, coding live in Vim. It aims to take intermediate programmers toward real Python expertise.
 4:48
Hans Rosling's 200 Countries, 200 Years, 4 Minutes - The Joy of Stats - BBC
11.5M views • 15 years ago
BBC
Hans Rosling uses augmented-reality animation to show 200 countries over 200 years in four minutes, built from 120,000 data points. It tracks life expectancy and income to show the world's development.
Topic match · Data visualization & information design 1:27:46
CppCon 2014: Mike Acton "Data-Oriented Design and C++"
862K views • 12 years ago
CppCon
Mike Acton of Insomniac Games argues that a program's purpose is transforming data, and shows how common C++ approaches work against that in performance-critical game development. He covers cache behavior, data layout and the limits of compilers.
 1:06:00
CppCon 2017: Juan Pedro Bolivar Puente “Postmodern immutable data structures”
31K views • 9 years ago
CppCon
Juan Pedro Bolivar Puente explains immutable and persistent data structures in C++ and how they support value semantics. He presents the Immer library, rrb-trees, and a prototype text editor that opens a huge file instantly.
 4:51
VisiData Lightning Demo at PyCascades 2018
41K views • 8 years ago
Saul Pwanson
A five-minute lightning demo of VisiData, a terminal tool for exploring and manipulating data. It uses two months of NYC 311 complaint data to drill down, plot points on a virtual map and save selected rows.
 55:53
Michael Stonebraker | Big Data is (at least) Four Different Problems
30K views • 10 years ago
Michigan Engineering
Database pioneer Michael Stonebraker argues that 'big data' is really at least four different problems: big volumes with small analytics, big analytics, velocity, and variety. He comments on where each market is heading.
 31:11
React.js Conf 2015 - Immutable Data and React
159K views • 11 years ago
Meta Developers
Lee Byron of Facebook explains how persistent immutable data structures work and how to use them in React apps with Immutable.js. He covers memoization benefits and avoiding coupling through shared mutable state.
 1:06:24
Rich Hickey: Deconstructing the Database
106K views • 14 years ago
InfoQ
Rich Hickey, creator of Clojure and designer of Datomic, gives a JaxConf 2012 talk that takes apart traditional database architecture. He presents a different way to think about databases and explains the reasoning behind Datomic's fact-based design.
 1:02:57
Peter Norvig - The Unreasonable Effectiveness of Data
74K views • 15 years ago
UBC Computer Science
Peter Norvig's UBC distinguished lecture on how massive amounts of simple data, such as for language modeling, can yield understanding that hand-built models could not.
 18:31
The Fallen of World War II
15.1M views • 10 years ago
Neil Halloran
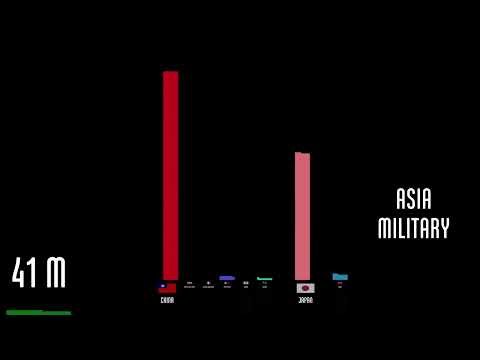
Neil Halloran's animated, data-driven documentary visualizes the human cost of World War II and compares it with other wars and the trend toward fewer war deaths in recent decades.
Topic match · Data visualization & information design 14:25
A Time-Lapse Map of Every Nuclear Explosion Since 1945 - by Isao Hashimoto
15.8M views • 16 years ago
aConcernedHuman
Isao Hashimoto's time-lapse map shows all 2053 nuclear explosions between 1945 and 1998, with each nation getting a blip and a running tally. Each second represents one month.
Topic match · Data visualization & information design 45:08
Raymond Hettinger - Dataclasses: The code generator to end all code generators - PyCon 2018
130K views • 8 years ago
PyCon 2018
Raymond Hettinger explains Python's dataclasses module, showing the problem it solves and its key design decisions. He places it in a progression from tuples and dicts through named tuples and attrs.
 1:26:11
Succinct Data Structures
9K views • 12 years ago
Edward Kmett
Edward Kmett's 2013 talk at Prezi in Budapest on succinct data structures, which store data in close to the information-theoretic minimum space while supporting fast queries. It ties together the research and walks through his Haskell succinct library.
 22:58
All of our data is GONE!
9.4M views • 10 years ago
Linus Tech Tips
Linus Tech Tips documents a major RAID failure on its Whonnock server and the attempt to recover the lost data with a data recovery firm.
 28:31
Velocity 2010: James Hamilton, "Datacenter Infrastructure Innovation"
9K views • 16 years ago
O'Reilly
James Hamilton of AWS gives a Velocity 2010 keynote on datacenter infrastructure innovation, focused on power and cooling costs and a breakdown of where datacenter spending goes.
 8:05
800+ days of Minecraft in 8 minutes
2.8M views • 13 years ago
Minecraft
A Gource visualization of 826 days of Minecraft development, from alpha 1.2 to release 1.5, condensed into eight minutes. Each dot is a file, folders are links, and developers fly around zapping files as they work on them.
Topic match · Data visualization & information design 3:39
AWS re:Invent 2016: Move Exabyte-Scale Data Sets with AWS Snowmobile
238K views • 9 years ago
Amazon Web Services
AWS's short promo for Snowmobile, a 45-foot shipping container pulled by a semi truck that moves up to 100PB of data to AWS.
 16:15
LGR Oddware - MiniDisc Data Storage: Sony MDH-10
623K views • 8 years ago
LGR
An LGR Oddware episode looking at Sony's MDH-10 MD Data drive from 1995, which used MiniDisc for computer storage years before Hi-MD. The host tries out the drive with its original drivers and software.
 5:28
Inside a Google data center
22.6M views • 11 years ago
Google Workspace
Joe Kava, VP of Google's Data Center Operations, gives a short tour of a Google data center. He covers security, sustainability and the core infrastructure architecture.
 19:09
A Better Default Colormap for Matplotlib | SciPy 2015 | Nathaniel Smith and Stéfan van der Walt
177K views • 11 years ago
Enthought
SciPy 2015 talk by Nathaniel Smith and Stefan van der Walt on choosing a new default colormap for Matplotlib. It covers why Jet misleads, how perceptual color spaces work, and how viridis was designed.
Topic match · Data visualization & information design 1:19:57
Simon Peyton Jones: Data Parallel Haskell
28K views • 16 years ago
nuACM
Simon Peyton Jones explains nested data parallelism and Data Parallel Haskell, an approach to exploiting multicore and distributed hardware while keeping a simple single-control-flow programming model.
 1:01:50
BahnMining - Pünktlichkeit ist eine Zier (David Kriesel)
3.3M views • 6 years ago
media.ccc.de
David Kriesel's 36C3 talk, in German, analyzes a year of scraped data on every stop of every long-distance train in Germany. It shows how Deutsche Bahn delay statistics hide cancellations and delays.
Topic match · Data visualization & information design 5:11
Asteroid Discovery - 1970-2015 - 8K resolution
298K views • 11 years ago
Scott Manley
Scott Manley's short animation shows every asteroid discovery from 1970 to 2015 plotted over time in 8K. It makes visible how survey technology made discoveries accelerate and where telescopes looked.
Topic match · Data visualization & information design 8:47
Oracle is destined to beat Amazon at cloud database: Larry Ellison
398K views • 8 years ago
Fox Business
Fox Business interview in which Oracle co-founder Larry Ellison claims Oracle will beat Amazon at cloud databases. He argues the world's valuable data lives in Oracle and says Amazon struggled to move off it.
 47:43
"Turning the database inside out with Apache Samza" by Martin Kleppmann
205K views • 12 years ago
Strange Loop Conference
Martin Kleppmann argues that databases are global shared mutable state and proposes treating them as an ever-growing log of immutable facts. Derived data such as caches, indexes and views is then built by stream processors like Apache Samza. The talk draws on Kafka and LinkedIn's experience with commit logs.
 6:40
Overpopulation – The Human Explosion Explained
14M views • 9 years ago
Kurzgesagt – In a Nutshell
A Kurzgesagt explainer on why the human population exploded and why growth is slowing, drawing on Our World in Data. It argues that birth rates fall as countries develop, easing overpopulation fears.
Topic match · Data visualization & information design 3:47
Flying Dream
18K views • 14 years ago
Gary Garrett
Gary Garrett's stop-motion animation of his song Flying Dream, with notes arranged on a lattice of fifths and major thirds. It shows how harmony looks in just intonation, inspired by Harmonic Experience.
Topic match · Data visualization & information design