data visualization
 6:31
The Known Universe by AMNH #datavisualization
17.3M views • 16 years ago
American Museum of Natural History
The American Museum of Natural History's film flies from the Himalayas out through the atmosphere and solar system to the afterglow of the Big Bang, using its Digital Universe Atlas four-dimensional map.
 14:48
Sonification & The Problem with Making Music from Data
259K views • 9 years ago
Tantacrul
Tantacrul examines sonification, the practice of turning data into sound or music, and critiques how scientists and musicians, including NASA and CERN projects, use it well and poorly.
 4:58
Most Popular Programming Languages 1965 - 2019
7.2M views • 7 years ago
Data Is Beautiful
An animated ranking of the most popular programming languages from 1965 to 2019, built from popularity indexes, GitHub access data and historical surveys.
Topic match · Data visualization & information design 6:08
Immigration, World Poverty and Gumballs
6.8M views • 16 years ago
NumbersUSA
Roy Beck's short gumball presentation using World Bank and Census data to argue that letting people immigrate to the US cannot solve world poverty because the numbers are so large. It is made by NumbersUSA, an immigration-restriction advocacy group.
Topic match · Data visualization & information design 10:16
Hans Rosling: Global population growth, box by box
1.9M views • 16 years ago
TED
Hans Rosling's TED@Cannes talk uses boxes and animated data graphics to show how world population will grow to about 9 billion. He argues that raising living standards for the poorest is what reduces population growth.
Topic match · Data visualization & information design 11:42
See how the rest of the world lives, organized by income | Anna Rosling Rönnlund
881K views • 8 years ago
TED
Anna Rosling Rönnlund presents Dollar Street, a project photographing homes in dozens of countries, from stoves to beds to toilets, and sorting them by income. She shows how data visualization can change how we see the world.
Topic match · Data visualization & information design 10:00
Nuclear Detonation Timeline "1945-1998"
1.2M views • 16 years ago
Don't Blink
A timeline visualization plotting the 2053 nuclear tests and detonations from 1945 to 1998 on a world map, with sound marking each blast. It conveys the pace of the nuclear arms race.
Topic match · Data visualization & information design 4:48
Hans Rosling's 200 Countries, 200 Years, 4 Minutes - The Joy of Stats - BBC
11.5M views • 15 years ago
BBC
Hans Rosling uses augmented-reality animation to show 200 countries over 200 years in four minutes, built from 120,000 data points. It tracks life expectancy and income to show the world's development.
Topic match · Data visualization & information design 4:51
VisiData Lightning Demo at PyCascades 2018
41K views • 8 years ago
Saul Pwanson
A five-minute lightning demo of VisiData, a terminal tool for exploring and manipulating data. It uses two months of NYC 311 complaint data to drill down, plot points on a virtual map and save selected rows.
 18:31
The Fallen of World War II
15.1M views • 10 years ago
Neil Halloran
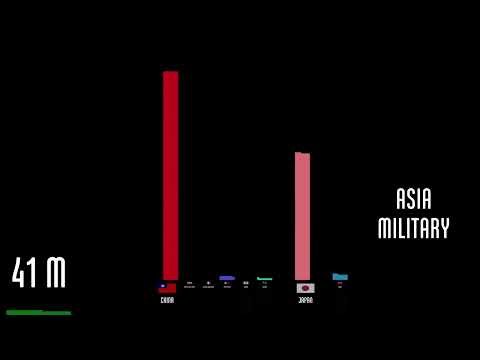
Neil Halloran's animated, data-driven documentary visualizes the human cost of World War II and compares it with other wars and the trend toward fewer war deaths in recent decades.
Topic match · Data visualization & information design 14:32
Orbital Data Centers Yes or No
18K views • 1 year ago
Eager Space
Eager Space examines the practicality of putting data centers in orbit, walking through three scenarios with cost calculations and the launch cost reductions that would be required.
 14:25
A Time-Lapse Map of Every Nuclear Explosion Since 1945 - by Isao Hashimoto
15.8M views • 16 years ago
aConcernedHuman
Isao Hashimoto's time-lapse map shows all 2053 nuclear explosions between 1945 and 1998, with each nation getting a blip and a running tally. Each second represents one month.
Topic match · Data visualization & information design 16:37
Does It Make Sense To Put Data Centers In Space? Can They Really Cost Less To Operate?
502K views • 2 years ago
Scott Manley
Scott Manley analyzes the idea of putting data centers in orbit, prompted by Lumen Orbit's funding. He examines the claimed advantage of constant solar power against launch cost, cooling and mass.
 8:05
800+ days of Minecraft in 8 minutes
2.8M views • 13 years ago
Minecraft
A Gource visualization of 826 days of Minecraft development, from alpha 1.2 to release 1.5, condensed into eight minutes. Each dot is a file, folders are links, and developers fly around zapping files as they work on them.
Topic match · Data visualization & information design 16:15
LGR Oddware - MiniDisc Data Storage: Sony MDH-10
623K views • 8 years ago
LGR
An LGR Oddware episode looking at Sony's MDH-10 MD Data drive from 1995, which used MiniDisc for computer storage years before Hi-MD. The host tries out the drive with its original drivers and software.
 5:28
Inside a Google data center
22.6M views • 11 years ago
Google Workspace
Joe Kava, VP of Google's Data Center Operations, gives a short tour of a Google data center. He covers security, sustainability and the core infrastructure architecture.
 9:40
HOW TO DATAMOSH: PART 1
433K views • 17 years ago
datamosher
A how-to video on datamoshing, the glitch-art technique of removing keyframes so that motion data smears across video. It walks through the tools needed, such as ffmpegx and Avidemux, though the author notes parts are outdated.
 19:09
A Better Default Colormap for Matplotlib | SciPy 2015 | Nathaniel Smith and Stéfan van der Walt
177K views • 11 years ago
Enthought
SciPy 2015 talk by Nathaniel Smith and Stefan van der Walt on choosing a new default colormap for Matplotlib. It covers why Jet misleads, how perceptual color spaces work, and how viridis was designed.
Topic match · Data visualization & information design 10:20
Dev Deletes Entire Production Database, Chaos Ensues
3.6M views • 3 years ago
Kevin Fang
Kevin Fang comically retells GitLab's 2017 incident in which an engineer deleted the production database, based on the company's postmortems. It walks through the confusion and failed backups.
 5:11
Asteroid Discovery - 1970-2015 - 8K resolution
298K views • 11 years ago
Scott Manley
Scott Manley's short animation shows every asteroid discovery from 1970 to 2015 plotted over time in 8K. It makes visible how survey technology made discoveries accelerate and where telescopes looked.
Topic match · Data visualization & information design 8:47
Oracle is destined to beat Amazon at cloud database: Larry Ellison
398K views • 8 years ago
Fox Business
Fox Business interview in which Oracle co-founder Larry Ellison claims Oracle will beat Amazon at cloud databases. He argues the world's valuable data lives in Oracle and says Amazon struggled to move off it.
 6:40
Overpopulation – The Human Explosion Explained
14M views • 9 years ago
Kurzgesagt – In a Nutshell
A Kurzgesagt explainer on why the human population exploded and why growth is slowing, drawing on Our World in Data. It argues that birth rates fall as countries develop, easing overpopulation fears.
Topic match · Data visualization & information design 5:50
15 Sorting Algorithms in 6 Minutes
29.4M views • 13 years ago
Timo Bingmann
A visualization and sonification of 15 sorting algorithms, from selection sort to bogo sort, run on shuffled integers in six minutes. Each algorithm gets a size and speed scaled to its complexity.
Topic match · Data visualization & information design 11:01
The Power of Big Data and Psychographics | 2016 Concordia Annual Summit
733K views • 10 years ago
Concordia
Alexander Nix of Cambridge Analytica presents at the 2016 Concordia Summit on using big data, psychographic profiling and behavioral microtargeting in elections.
 12:20
I Solved Klotski
2.1M views • 1 year ago
2swap
2swap explains how he solved the Klotski sliding-block puzzle by mapping its full state space as a graph and visualizing it. The video includes footage of the Guinness world-record solve and links to an interactive graph.
Topic match · Data visualization & information design 4:29
Tesla Crash Lab | Data-Driven Safety
1M views • 5 years ago
Tesla
A short Tesla promotional video touring the company's Crash Lab. It describes using data from the fleet and replicated real-world crash scenarios to engineer vehicle safety.
 15:05
Steve Yegge, "What Would You Do With Your Own Google?" - OSCON Data 2011
66K views • 15 years ago
O'Reilly
Steve Yegge's OSCON Data 2011 talk imagines what you could do with Google-scale storage and compute a decade later. He argues smart people should work on hard problems such as biology rather than cat pictures, and the talk ends with a moment many took as him quitting Google.
 9:09
Animations of unseeable biology | Drew Berry | TED
2.7M views • 14 years ago
TED
Drew Berry shows scientifically accurate animations of molecular processes inside cells, such as DNA replication, at TEDxSydney.
Topic match · Data visualization & information design 6:51
Star Size Comparison 2
48.7M views • 10 years ago
morn1415
A visual scale comparison of stars and cosmic objects, from planets up to some of the largest known stars, set to music. It is meant to convey the vastness of the universe.
Topic match · Data visualization & information design 13:21
Religions and babies | Hans Rosling
1.7M views • 14 years ago
TED
Hans Rosling's TEDxSummit talk asks whether some religions have higher birth rates and how that affects population growth. He charts data across time and religions and reaches a surprising conclusion about fertility.
Topic match · Data visualization & information design 4:17
The Hubble Ultra Deep Field in 3D
9.6M views • 17 years ago
Deep Astronomy
A short video built around an animation of the roughly 10,000 galaxies in the Hubble Ultra Deep Field, placed at their measured redshift distances. It gives a brief history of deep field images and ends with a 3D fly-through.
Topic match · Data visualization & information design 6:46
Dabble DB demo
10K views • 19 years ago
krueggen
A short product demo of Dabble DB, a web tool for importing, entering and manipulating structured data with little effort. It was built in Smalltalk and later acquired by Twitter.
 18:33
Is the world getting better or worse? A look at the numbers | Steven Pinker
1.6M views • 8 years ago
TED
Steven Pinker's TED talk presents data on homicide, war, poverty and pollution to argue that the world has improved over the past decades. He frames progress as problem-solving, not inevitability.
Topic match · Data visualization & information design 6:40
High Res Wifi Signal Mapping
551K views • 11 years ago
CNLohr
CNLohr maps Wi-Fi signal strength at high resolution by moving an ESP8266 on a CNC mill, then visualizes the 3D data in WebGL. The result shows interference patterns in space.
Topic match · Data visualization & information design 5:13
A$AP Mob - Yamborghini High (Official Video) ft. Juicy J
180.4M views • 10 years ago
asapmobVEVO
The official music video for A$AP Mob's Yamborghini High featuring Juicy J, known for heavy datamoshing and glitch effects with hue shifting.
 8:23
A Century Of US Cooling - Erased By NOAA
21K views • 8 years ago
Tony Heller
Tony Heller argues that US thermometer data shows a century of cooling and that NOAA adjusts the record to produce a warming trend.
 17:08
We Went to the Town Elon Musk Is Poisoning
4.3M views • 1 year ago
More Perfect Union
A More Perfect Union report on xAI's data center in Memphis, which residents say burns gas without permits or pollution controls and harms their health.
 18:18
✖️Coronavirus TIMELINE
208K views • 6 years ago
Nathan Rich
A data-visualization style timeline of the early coronavirus outbreak events by YouTuber Nathan Rich. It lays out dates of key developments in China.
Topic match · Data visualization & information design 16:27
Weather: Last Week Tonight with John Oliver (HBO)
8M views • 7 years ago
LastWeekTonight
A Last Week Tonight segment on the tension between public and private weather forecasting, including NOAA data and AccuWeather's lobbying against free public weather data.
 19:10
How not to be ignorant about the world | Hans and Ola Rosling
3.1M views • 12 years ago
TED
Hans Rosling and his son Ola run an audience quiz with global population, health and income data to show how wrong most people are about the world. Ola then gives four ways to get less ignorant.
Topic match · Data visualization & information design