graphics
 11:27
CGA Graphics - Not as bad as you thought!
2.4M views • 10 years ago
The 8-Bit Guy
The 8-Bit Guy covers IBM's 1981 CGA graphics system, including how composite output and artifacting produced extra colors beyond the nominal palette. He argues CGA looked better in period than it does on RGB monitors.
 7:08
How "oldschool" graphics worked Part 1 - Commodore and Nintendo
5.7M views • 11 years ago
The 8-Bit Guy
The 8-Bit Guy explains the color limitations of 1980s computers and consoles such as the NES and Commodore 64. It shows how sprites, attributes and palettes shaped the look of old games.
 9:32
Disney's Practical Guide to Path Tracing
914K views • 10 years ago
Walt Disney Animation Studios
Walt Disney Animation Studios' short introduction to path tracing, showing how rays are traced and bounced through a virtual scene to simulate light. It explains how this approach is used in animated films.
Topic match · Computer graphics & rendering 6:40
Overpopulation – The Human Explosion Explained
14M views • 9 years ago
Kurzgesagt – In a Nutshell
A Kurzgesagt explainer on why the human population exploded and why growth is slowing, drawing on Our World in Data. It argues that birth rates fall as countries develop, easing overpopulation fears.
Topic match · Social issues & culture 4:14
Computer Color is Broken
4.3M views • 11 years ago
minutephysics
MinutePhysics explains that computers store brightness nonlinearly, so blurring and blending colors in raw RGB gives wrong, dark results. It shows why mixed colors, such as in gradients, look off.
Topic match · Computer graphics & rendering 4:17
AI Learns Noise Filtering For Photorealistic Videos | Two Minute Papers #215
65K views • 8 years ago
Two Minute Papers
A Two Minute Papers episode on NVIDIA's recurrent denoising autoencoder, which cleans up noisy Monte Carlo path-traced image sequences. It shows how a neural network can produce usable renders from very few samples.
Topic match · Computer graphics & rendering 8:09
Google Earth’s Incredible 3D Imagery, Explained
3.1M views • 9 years ago
Nat and Friends
A short explainer from Nat and Friends on where Google Earth's 3D imagery comes from, how it is stitched together, and how often it is updated. It describes aircraft carrying camera rigs and photogrammetry that turns the photos into 3D models.
Topic match · Computer graphics & rendering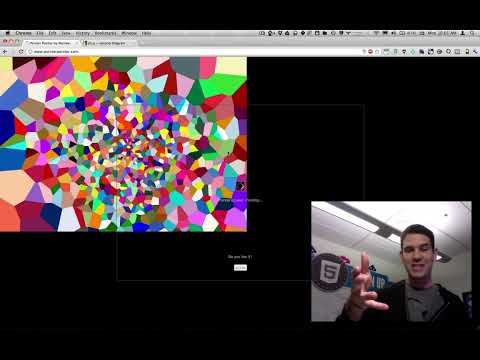 3:45
pointerpointer.com's use of voronoi, canvas, and javascript
40K views • 14 years ago
Paul Irish
Paul Irish explains how pointerpointer.com works. It uses a hidden canvas of colored Voronoi regions to look up which photo matches the cursor position.
Topic match · Computer graphics & rendering 5:26
Neural Network Learns The Physics of Fluids and Smoke | Two Minute Papers #118
209K views • 9 years ago
Two Minute Papers
Two Minute Papers covers a paper on speeding up fluid and smoke simulation with convolutional networks. It contrasts the approach with earlier regression forest methods.
Topic match · Computer graphics & rendering 4:48
Hans Rosling's 200 Countries, 200 Years, 4 Minutes - The Joy of Stats - BBC
11.5M views • 15 years ago
BBC
Hans Rosling uses augmented-reality animation to show 200 countries over 200 years in four minutes, built from 120,000 data points. It tracks life expectancy and income to show the world's development.
Topic match · Data visualization & information design 7:49
America Keeps Rejecting an ID Card It Already Has
13.6M views • 9 years ago
CGP Grey
CGP Grey explains the history of the US Social Security card and number, and why they became a de facto national ID despite never being meant for it. He also covers why America resists a proper identity card.
Topic match · Social issues & culture 6:24
Wealth Inequality in America
26.7M views • 13 years ago
politizane
A short infographic video on the distribution of wealth in America, contrasting what people believe, what they consider ideal, and the actual numbers. It highlights how top-heavy US wealth is.
Topic match · Data visualization & information design 6:08
Immigration, World Poverty and Gumballs
6.8M views • 16 years ago
NumbersUSA
Roy Beck's short gumball presentation using World Bank and Census data to argue that letting people immigrate to the US cannot solve world poverty because the numbers are so large. It is made by NumbersUSA, an immigration-restriction advocacy group.
Topic match · Social issues & culture 6:51
Star Size Comparison 2
48.7M views • 10 years ago
morn1415
A visual scale comparison of stars and cosmic objects, from planets up to some of the largest known stars, set to music. It is meant to convey the vastness of the universe.
Topic match · Data visualization & information design 6:18
Animated Voting Methods
16K views • 9 years ago
Unify The Vote
An animated simulation comparing single-winner voting methods such as plurality, instant runoff and STAR. Colored regions show which candidate wins as a randomized electorate shifts across a two-dimensional political space, building on Ka-Ping Yee's earlier diagrams.
Topic match · Data visualization & information design 41:35
The Alt-Right Playbook: How to Radicalize a Normie
4.5M views • 7 years ago
Innuendo Studios
A video essay from the Alt-Right Playbook series that explains how extremist movements draw ordinary people in, using deniable rhetoric, bad-faith games, and gradual escalation. It draws on books about the alt-right, male radicalization, and cult-style brainwashing.
Topic match · Social issues & culture 13:36
Chinese Invisibility Cloak Hoax DESTROYED!!!
6.8M views • 8 years ago
Captain Disillusion
Captain Disillusion debunks a viral Chinese invisibility cloak video while parodying popular educational channels. Along the way he explains chroma keying and green screen techniques.
Topic match · Animation & visual effects 6:47
The US Has More Tribes Than the World Has Countries
7.3M views • 6 years ago
CGP Grey
CGP Grey explains why "Indian" is often preferred over "Native American" in the United States, especially near reservations, and how many tribes exist in the US. He draws on conversations with people who identify as Indian.
Topic match · Social issues & culture 14:57
Prius Hybrid Drive Explained
1.1M views • 10 years ago
Niels Blaauw
A Blender-animated explanation of the Toyota Hybrid Synergy Drive, showing how the engine, two motor-generators, planetary gearset and battery work together as an eCVT.
Topic match · Animation & visual effects 10:23
RSA ANIMATE: Smile or Die
2.5M views • 16 years ago
Royal Society of Arts
An RSA Animate drawing of Barbara Ehrenreich's talk on the darker side of positive thinking. It argues that forced positivity in culture, work and policy can be harmful and played a part in the financial crisis.
Topic match · Social issues & culture 3:49
Gender Neutral Pronouns: They're Here, Get Used To Them
4.6M views • 13 years ago
Tom Scott
Tom Scott argues that grammatical gender is a silly concept and that the singular 'they' is an established gender-neutral pronoun. The description carries later corrections and reflections he added in 2019.
Topic match · Social issues & culture 7:01
Why is it so Easy to be Thin in Japan?
25M views • 8 years ago
Joseph Everett - WIL
Joseph Everett compares the food environment of the US, with roughly 30% obesity, to Japan's, around 3.5%. He argues that what is available and normal to eat explains much of the gap.
Topic match · Social issues & culture 2:51
Tea Consent
12.4M views • 11 years ago
Blue Seat Studios
A three-minute animated video that explains sexual consent through the analogy of offering someone a cup of tea. It is based on a blog post by Emmeline May.
Topic match · Social issues & culture 7:37
Satoshi Kon - Editing Space & Time
4M views • 12 years ago
Every Frame a Painting
A video essay from Every Frame a Painting on animator Satoshi Kon and his editing style, which distorts and warps space and time. It draws on his four features and one TV series.
Topic match · Animation & visual effects 14:24
Why Japan Arrests Foreigners
8.6M views • 7 years ago
Paolo fromTOKYO
Paolo fromTOKYO explains why foreign tourists get arrested in Japan, covering strict laws and the justice system's very high conviction rate.
Topic match · Social issues & culture 10:45
Back to the Future | VFXcool (1/2)
2.2M views • 9 years ago
Captain Disillusion
Captain Disillusion explains the visual effects behind the Back to the Future trilogy. He covers ILM's motion-control, computer-controlled camera work and clever pre-CGI tricks.
Topic match · Animation & visual effects 8:33
Drawing Conclusions: Is renting really a waste of money?
5.4M views • 11 years ago
The Globe and Mail
A short Globe and Mail animated explainer on why renting can leave you as well off as buying a home. It walks through a rent-versus-buy comparison using Toronto numbers and the opportunity cost of a down payment. The video notes it dates from 2015 and the housing market has changed since.
Topic match · Data visualization & information design 4:01
Why You Will Marry the Wrong Person
1.9M views • 11 years ago
The School of Life
A School of Life video arguing that everyone marries someone who is somewhat wrong for them, and that this is unavoidable. It is a four-minute version of an essay by Alain de Botton.
Topic match · Social issues & culture 4:13
Social Inequalities Explained in a $100 Race - Please Watch to the End. Thanks.
5M views • 9 years ago
Peter D
A short animated explainer that stages a $100 footrace in which contestants start at different distances from the line, depending on the advantages or disadvantages they inherited. It uses the race as a metaphor for how unequal starting points shape outcomes, citing US census income and poverty figures.
Topic match · Social issues & culture 6:21
Your Body's Molecular Machines
5.1M views • 8 years ago
Veritasium
Veritasium short showing Drew Berry's scientifically accurate animations of the molecular machines that drive cell division. It walks through mitosis, chromosomes and motor proteins.
Topic match · Animation & visual effects 10:18
How to Stop a Riot
5.2M views • 9 years ago
Wendover Productions
Wendover Productions explains counterintuitive riot control techniques based on research, showing that effective tactics tend to avoid violence.
Topic match · Social issues & culture 23:10
Juvenoia
10.6M views • 11 years ago
Vsauce
Vsauce looks at 'juvenoia', the exaggerated fear that new media and youth culture are corrupting the young. It gives historical examples of older generations complaining about the next one.
Topic match · Social issues & culture 11:45
The History of Europe: Every Year
33.9M views • 8 years ago
Cottereau
An animated map showing the borders and populations of European countries for every year since 400 BC. Vassal states and colonies are excluded from population counts.
Topic match · Data visualization & information design 2:50
Tea and Consent
10.5M views • 10 years ago
Thames Valley Police
A short animation from Thames Valley Police that explains sexual consent by comparing it to offering someone a cup of tea.
Topic match · Social issues & culture