math visualization
 19:20
Conrad Wolfram: Teaching kids real math with computers
363K views • 15 years ago
TED
Conrad Wolfram argues that the part of math taught in schools, hand calculation, is tedious and mostly irrelevant to real mathematics. He proposes teaching math through computer programming so students can tackle real problems.
 1:07:34
What Happens When Maths Goes Wrong? - with Matt Parker
3.3M views • 7 years ago
The Royal Institution
Matt Parker's Royal Institution talk based on his book Humble Pi, covering everyday mathematical mistakes and spurious patterns that went wrong in engineering and software. It mixes stand-up comedy with stories of coincidence and error.
 48:39
4 2 1 Christopher Domas The future of RE Dynamic Binary Visualization
59K views • 14 years ago
Adrian Crenshaw
Christopher Domas presents his Cantor Dust tool at Derbycon 2012, a 3D visual approach to reverse engineering binaries by visualizing their structure dynamically.
 1:03:22
REcon 2013 - The Future of RE : Dynamic Binary Visualization (Christopher Domas)
9K views • 12 years ago
Sébastien Duquette
Christopher Domas's REcon 2013 talk on dynamic binary visualization for reverse engineering. He shows how rendering binary data as interactive visual maps and trigraphs reveals structure that hex dumps hide, leading to his Cantor.dust tool.
 35:16
Bret Victor - Drawing Dynamic Visualizations
17K views • 11 years ago
Colin McDonnell
Bret Victor's talk on Drawing Dynamic Visualizations. It argues that visualization tools offer either the directness of hand drawing or the dynamics of programmed graphics, and shows a tool that combines both.
 1:14:48
The Future of Mathematics?
116K views • 7 years ago
Microsoft Research
Mathematician Kevin Buzzard explains why he believes the Lean theorem prover will shape the future of mathematics, and describes digitizing his university curriculum in Lean with undergraduates, plus the cultural challenges.
 17:01
The mathematics of love | Hannah Fry
2M views • 11 years ago
TED
Mathematician Hannah Fry's TED talk on patterns in dating and mate-seeking, including optimal stopping and three math-backed tips for finding a partner.
 30:55
[JSConfUS 2013] Steven Wittens: Making WebGL Dance
56K views • 13 years ago
JSConf
Steven Wittens' JSConf US 2013 talk on drawing with WebGL, using animated visuals to walk through vectors, matrices and the rendering pipeline. Despite the title, it works as a visual primer on the linear algebra behind 3D graphics.
 1:01:40
Four Dimensional Maths: Things to See and Hear in the Fourth Dimension - with Matt Parker
3.1M views • 11 years ago
The Royal Institution
Matt Parker gives a hands-on Royal Institution talk on how four-dimensional shapes appear in a 3D world, with props like straw frames, Mobius strips and a knitted hat. It is a playful general-audience tour of the fourth dimension.
 27:45
Gerald Jay Sussman: The Role of Programming (Dan Friedman's 60th Birthday)
22K views • 11 years ago
William Byrd
Gerald Jay Sussman speaks at Dan Friedman's 60th birthday celebration about how programming helps formulate and clarify ideas. He argues that ambiguous mathematical notation hinders understanding.
 26:53
What the heck is the event loop anyway? | Philip Roberts | JSConf EU
3.8M views • 12 years ago
JSConf
Philip Roberts explains the JavaScript event loop, call stack, callbacks and asynchronous behavior with live visualizations using a tool he built. It demystifies terms like non-blocking and single-threaded.
 21:26
The mathematics of weight loss | Ruben Meerman | TEDxQUT (edited version)
12.6M views • 13 years ago
TEDx Talks
Ruben Meerman presents a TEDx talk on the stoichiometry of weight loss, showing with lab demonstrations where fat goes when it is lost. He argues that most of it is exhaled as carbon dioxide.
 11:42
See how the rest of the world lives, organized by income | Anna Rosling Rönnlund
881K views • 8 years ago
TED
Anna Rosling Rönnlund presents Dollar Street, a project photographing homes in dozens of countries, from stoves to beds to toilets, and sorting them by income. She shows how data visualization can change how we see the world.
 1:28:31
FoodGate: The Break-in, the Cover-up, & the Aftermath
2.1M views • 8 years ago
University of California Television (UCTV)
A UCTV panel with endocrinologist Robert Lustig, dentist Cristen Kearns and health policy expert Laura Schmidt on how the US food system and sugar industry influence diet and health, including industry efforts to shape the science.
 30:18
Alexander Nix: From Mad Men to Math Men | OMR Festival 2017 - Hamburg, Germany | #OMR17
117K views • 9 years ago
OMR
Cambridge Analytica CEO Alexander Nix keynotes the OMR 2017 marketing festival on big data and personality-based targeting in political campaigns. It was given before the company's scandal broke.
 55:10
Visualizing Data Using t-SNE
204K views • 13 years ago
Google TechTalks
A Google Tech Talk by Laurens van der Maaten, co-creator of t-SNE, on visualizing high-dimensional data by mapping it to two dimensions. It explains how the technique works and how it compares with other visualization approaches.
 19:09
A Better Default Colormap for Matplotlib | SciPy 2015 | Nathaniel Smith and Stéfan van der Walt
177K views • 11 years ago
Enthought
SciPy 2015 talk by Nathaniel Smith and Stefan van der Walt on choosing a new default colormap for Matplotlib. It covers why Jet misleads, how perceptual color spaces work, and how viridis was designed.
 9:09
Animations of unseeable biology | Drew Berry | TED
2.7M views • 14 years ago
TED
Drew Berry shows scientifically accurate animations of molecular processes inside cells, such as DNA replication, at TEDxSydney.
 20:36
The best stats you've ever seen | Hans Rosling
4.4M views • 19 years ago
TED
Hans Rosling uses the Gapminder animated-data tool to debunk myths about world development, with sportscaster-like energy. It shows trends in health, income and child survival across countries.
 51:16
Why can't you multiply vectors?
524K views • 3 years ago
Freya Holmér
Freya Holmer's Dutch Game Day 2023 talk asking why vectors can't be multiplied, building from complex numbers to a single axiom and arriving at geometric algebra, quaternions and multivectors.
 15:12
Bret Victor - Seeing Spaces
21K views • 11 years ago
Colin McDonnell
Bret Victor's talk proposing a new kind of maker space built for seeing and understanding a project's behavior: inside it, across time and across possibilities. It argues for scientific understanding over recipes and rules of thumb.
 20:36
Hans Rosling: Debunking third-world myths with the best stats you've ever seen
2.2M views • 19 years ago
TED
In this TED talk, Hans Rosling uses animated statistics to debunk myths about the developing world, showing how health and income have improved across countries.
 40:39
Category Theory in Life - Eugenia Cheng
113K views • 9 years ago
Lambda World
Eugenia Cheng gives the opening keynote at Lambda World 2017, presenting category theory as very abstract algebra whose abstraction gives it broad applicability. She applies it to everyday questions including privilege and prejudice.
 1:36:54
Category Theory by Tom LaGatta
73K views • 12 years ago
AI Council
Tom LaGatta's talk on category theory at a 2014 LispNYC meetup, covering objects, morphisms and the basic ideas in an informal, conversational style. It runs about 97 minutes.
 28:12
Shawn Douglas - Nanoscale Instruments for Visualizing Small Proteins & Bret Victor - Dynamicland
20K views • 4 years ago
Foresight Institute
A Foresight Institute workshop video with two talks: Shawn Douglas on nanoscale instruments for visualizing small proteins, and Bret Victor on Dynamicland. Victor's part shows biomolecular design built in his Realtalk system with physical objects.
 10:16
Hans Rosling: Global population growth, box by box
1.9M views • 16 years ago
TED
Hans Rosling's TED@Cannes talk uses boxes and animated data graphics to show how world population will grow to about 9 billion. He argues that raising living standards for the poorest is what reduces population growth.
 48:10
Bay Area Vision Meeting: Unsupervised Feature Learning and Deep Learning
123K views • 15 years ago
Google TechTalks
Andrew Ng presents unsupervised feature learning and deep learning, showing how algorithms can learn representations from unlabeled data instead of hand-designed features. He gives examples in vision and audio, including visualizations of features learned by successive layers.
 52:22
Google Self-Driving Car Project | SXSW Interactive 2016
144K views • 10 years ago
SXSW
Chris Urmson's SXSW 2016 talk on Google's self-driving car project, covering 1.3 million self-driven miles and the gap between hype and reality. It shows sensor visualizations and playbacks of hard situations the cars met, and discusses failures such as the low-speed bus collision.
 21:16
Emacs + org-mode + python in reproducible research; SciPy 2013 Presentation
50K views • 13 years ago
Enthought
John Kitchin shows how Emacs org-mode with Python lets researchers combine narrative, math, figures and executable code in one document. It exports to LaTeX, HTML and PDF, and he used it for papers and e-books.
 1:07:43
2016 - On The Shoulders Of Giants - Damian Conway
12K views • 10 years ago
The Perl and Raku Conference - Greenville, SC 2026
Damian Conway's hour-long keynote at the Perl conference, On the Shoulders of Giants, showing off Perl 6 (Raku) features with history, algorithms and a quantum math operator built with grammars. It is delivered with comic flair.
 43:16
Pure Functional Programming in Excel • Felienne Hermans • GOTO 2016
26K views • 10 years ago
GOTO Conferences
Felienne Hermans argues that Excel is the world's most popular programming language and shows how spreadsheets work as a pure functional language. She implements a few mathematical problems in spreadsheet formulas to illustrate why they are so powerful and approachable.
 40:51
Geoffrey West on COMPLEXITY
23K views • 15 years ago
FQxI
Physicist Geoffrey West speaks at an FQXi conference on time about complexity and scaling laws. He covers how metabolism, growth and lifespan scale across organisms and how the same mathematics applies to cities and companies.
 25:01
Dan Abramov The wet codebase
27K views • 5 years ago
eswarnichtsmehrfrei
Dan Abramov's talk on the wet codebase, using visualizations to show how removing all duplication too early produces wrong abstractions that are hard to unwind.
 1:04:45
Stanford Seminar - Concatenative Programming: From Ivory to Metal
14K views • 8 years ago
Stanford Online
Jon Purdy's Stanford EE380 seminar giving an overview of concatenative programming, from function composition theory and history down to low-level implementation and correctness benefits.
 46:27
Sensor Fusion on Android Devices: A Revolution in Motion Processing
517K views • 16 years ago
Google TechTalks
David Sachs of InvenSense explains how gyroscopes, accelerometers and compasses work on their own and together, demonstrated on a modified Android handset. He covers sensor fusion algorithms and why rotation math such as Euler angles matters.
 31:18
Quantum Expert Insight: Peter Shor
607K views • 5 years ago
Qiskit
Peter Shor tells the story of how he discovered Shor's Algorithm, from his early mathematics days to the quantum factoring breakthrough. It was recorded at MIT at the Physics of Computation conference.
 5:12
The $8 billion iPod | Rob Reid
954K views • 14 years ago
TED
A five-minute TED talk by Rob Reid, who introduces Copyright Math, applying entertainment-industry piracy loss claims to produce absurd totals such as an $8 billion iPod.
 49:06
Perl 6 for Mere Mortals
6K views • 11 years ago
Curtis “Ovid” Poe
Curtis Poe's FOSDEM talk arguing that day-to-day Perl 6 is far simpler than its enthusiasts' talk of exotic features suggests. He compares basic math and string handling across languages.
 1:03:14
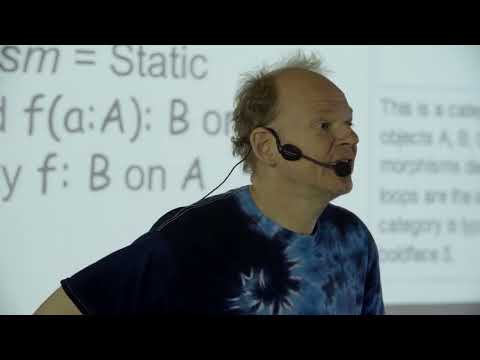
Category Theory, The essence of interface-based design - Erik Meijer
74K views • 11 years ago
FooCafe
Erik Meijer argues that category theory is the mathematicians' version of interface-based design. He shows that Java 8 lambdas and method references form a Cartesian closed category.
 44:45
Python at Massive Scale - Stephen Simmons, Neil Slinger
10K views • 8 years ago
PyData
A PyData London 2018 talk on how JPMorgan scaled its Athena Python platform over ten years to about 35 million lines of code and thousands of developers. It covers infrastructure, tooling and culture for analytics and visualization at that scale.