graph visualization
 1:03:22
REcon 2013 - The Future of RE : Dynamic Binary Visualization (Christopher Domas)
9K views • 12 years ago
Sébastien Duquette
Christopher Domas's REcon 2013 talk on dynamic binary visualization for reverse engineering. He shows how rendering binary data as interactive visual maps and trigraphs reveals structure that hex dumps hide, leading to his Cantor.dust tool.
 35:16
Bret Victor - Drawing Dynamic Visualizations
17K views • 11 years ago
Colin McDonnell
Bret Victor's talk on Drawing Dynamic Visualizations. It argues that visualization tools offer either the directness of hand drawing or the dynamics of programmed graphics, and shows a tool that combines both.
 48:39
4 2 1 Christopher Domas The future of RE Dynamic Binary Visualization
59K views • 14 years ago
Adrian Crenshaw
Christopher Domas presents his Cantor Dust tool at Derbycon 2012, a 3D visual approach to reverse engineering binaries by visualizing their structure dynamically.
 6:31
The Known Universe by AMNH #datavisualization
17.3M views • 16 years ago
American Museum of Natural History
The American Museum of Natural History's film flies from the Himalayas out through the atmosphere and solar system to the afterglow of the Big Bang, using its Digital Universe Atlas four-dimensional map.
 3:54
Deep Visualization Toolbox
270K views • 11 years ago
Jason Yosinski
A short demo of the Deep Visualization Toolbox, which shows the activations inside a convolutional neural network as it processes live camera input. Viewers see individual units responding to edges, faces and text.
 12:20
I Solved Klotski
2.1M views • 1 year ago
2swap
2swap explains how he solved the Klotski sliding-block puzzle by mapping its full state space as a graph and visualizing it. The video includes footage of the Guinness world-record solve and links to an interactive graph.
Topic match · Data visualization & information design 1:32:08
Theory and Practice of Cryptography
73K views • 18 years ago
Google TechTalks
A Google Tech Talk by Steve Weis that introduces modern cryptography and its use in practice and at Google. It covers proofs of security and security definitions and a special topic. HN commenters treat it as a talk on verifiable electronic voting.
 1:15:21
Marc Levoy - Lectures on Digital Photography - Lecture 1 (21mar16).mp4
512K views • 10 years ago
Marc Levoy
The first lecture in an 18-part series on digital photography from Marc Levoy's Stanford CS 178 course, recorded at Google in 2016. The series covers how digital cameras work and computational photography, with slides and assignments available on the course site.
 38:31
The $200M Machine that Prints Microchips: The EUV Photolithography System
2.4M views • 1 year ago
Branch Education
Branch Education's animated deep dive into ASML's EUV photolithography machine and how it prints nanometer-scale transistors onto chips. It covers the system's components and the process of chip manufacturing.
 46:06
Lower Latency Graph Queries in Cypher with Redis GraphRoi Lipman, Redis LabsTim Davis, Texas A&M U
3K views • 8 years ago
Redis
Redis Labs and Tim Davis present RedisGraph, which uses GraphBLAS to treat graph queries in Cypher as sparse linear algebra for lower latency.
 18:24
The Holographic Universe Explained
3.5M views • 7 years ago
PBS Space Time
A PBS Space Time episode explaining the holographic principle: the idea that our 3+1 dimensional universe may be described by information on a lower-dimensional boundary. It walks through black hole entropy and the AdS/CFT correspondence.
 27:58
GraphQL: The Documentary
603K views • 7 years ago
CultRepo
A documentary on how GraphQL came to be at Facebook, featuring its co-creators Lee Byron, Dan Schafer and Nick Schrock. It covers the problems it solved and its adoption at companies like Twitter, Airbnb and GitHub.
 21:08
Demographic Collapse — China's Reckoning (Part 1)
3M views • 5 years ago
PolyMatter
PolyMatter's first part of a series on China's demographic collapse, covering the effects of the one-child policy, shrinking workforce and economic consequences.
 3:26
Shop Vac (kinetic typography animation)
1.7M views • 15 years ago
jmheather
A kinetic typography animation for Jonathan Coulton's song 'Shop Vac', made by Jarrett Heather with Illustrator, After Effects and other tools over 500-1000 hours.
 17:51
Why I deleted GrapheneOS
976K views • 3 years ago
Louis Rossmann
Louis Rossmann explains why he stopped using GrapheneOS, describing his interactions with its lead developer Daniel Micay. It includes chat logs shown in the video.
 30:15
Antique 4x5 camera creates 20 micron photolithography masks: Super tiny tax form
429K views • 6 years ago
Applied Science
Ben Krasnow of Applied Science uses an antique 4x5 view camera to make high-resolution photolithography masks in a home shop. He photographs a poster-sized printout onto litho film to get features around 20 microns.
 11:42
See how the rest of the world lives, organized by income | Anna Rosling Rönnlund
881K views • 8 years ago
TED
Anna Rosling Rönnlund presents Dollar Street, a project photographing homes in dozens of countries, from stoves to beds to toilets, and sorting them by income. She shows how data visualization can change how we see the world.
Topic match · Data visualization & information design 5:10
Dual Photography
24K views • 17 years ago
mm648230
The SIGGRAPH 2005 demo of dual photography from Stanford, which swaps the roles of projector and camera to render a scene from the light's point of view. It includes the reveal of a hidden playing card.
 29:12
DEF CON 26 CRYPTO AND PRIVACY VILLAGE - Scott Arciszewski - No Way JOSE! Designing Cryptography
7K views • 7 years ago
DEFCONConference
Scott Arciszewski's DEF CON 26 Crypto and Privacy Village talk critiquing the JOSE standards (JWT, JWS, JWE) and showing how to design cryptographic tokens more safely.
 10:16
Hans Rosling: Global population growth, box by box
1.9M views • 16 years ago
TED
Hans Rosling's TED@Cannes talk uses boxes and animated data graphics to show how world population will grow to about 9 billion. He argues that raising living standards for the poorest is what reduces population growth.
Topic match · Data visualization & information design 3:11
NASA | A Year in the Life of Earth's CO2
4.9M views • 11 years ago
NASA Goddard
A short NASA Goddard visualization from the GEOS-5 model showing a year of atmospheric carbon dioxide moving around the globe. It shows plumes from sources, hemispheric differences and seasonal swings as plants grow and die back.
Topic match · Data visualization & information design 8:05
800+ days of Minecraft in 8 minutes
2.8M views • 13 years ago
Minecraft
A Gource visualization of 826 days of Minecraft development, from alpha 1.2 to release 1.5, condensed into eight minutes. Each dot is a file, folders are links, and developers fly around zapping files as they work on them.
Topic match · Data visualization & information design 1:37:22
Siggraph2019 Geometric Algebra
87K views • 7 years ago
Bivector
A SIGGRAPH 2019 course on geometric algebra. Charles Gunn gives an intro, then Steven De Keninck gives a programmer-focused course with live examples in ganja.js.
 29:16
SYMBOLICS S-PACKAGES 3D GRAPHICS AND ANIMATION DEMO
14K views • 13 years ago
Red Martian
A demo of the Symbolics Graphics Division's S-Packages, a Lisp-based 3D color graphics and animation system from the 1980s. It was later used in developing for the Nintendo 64.
 54:58
Keynote - JSON Graph: Reactive REST at Netflix
41K views • 11 years ago
Association for Computing Machinery (ACM)
Jafar Husain's ACM keynote presents Netflix's JSON Graph and Falcor, which let web developers treat all cloud data as one virtual JSON model. It combines reactive programming with REST principles.
 39:15
The Maximal Graph - Wilker Silva
8K views • 6 years ago
ClojureTV
A Clojure/conj 2019 talk by Wilker Silva on how namespace-qualified keywords and context-free federated names can be used pragmatically for data modeling, drawn from his experience at Nubank. It builds toward a graph-based view of connecting data from many sources.
 12:36
Why PlayStation 1 Graphics Warped and Wobbled so much | MVG
2.3M views • 6 years ago
Modern Vintage Gamer
Modern Vintage Gamer explains why PlayStation 1 graphics warped and jittered, comparing it with the Nintendo 64. The causes are affine texture mapping and the lack of sub-pixel vertex precision.
 53:40
GrapheneOS: Documenting Numerous Attacks Against CalyxOS,, Techlore, & More
135K views • 5 years ago
Techlore
A long Techlore video documenting what it presents as hostile conduct by GrapheneOS leadership and community members, including lead developer Daniel Micay, toward CalyxOS and others.
 8:38
Diffie-Hellman Key Exchange
938K views • 14 years ago
Art of the Problem
A short explainer on the history and mechanics of public key cryptography and the Diffie-Hellman key exchange. It uses a mixing-paint-colors analogy to show how two parties can agree on a shared secret in public.
 6:34
Stephen Fry Kinetic Typography - Language
3M views • 16 years ago
Built By Matt
A kinetic typography animation set to Stephen Fry's spoken essay on language. Fry argues against grammar pedantry and for the way language evolves, including the verbing of nouns.
 11:27
CGA Graphics - Not as bad as you thought!
2.4M views • 10 years ago
The 8-Bit Guy
The 8-Bit Guy covers IBM's 1981 CGA graphics system, including how composite output and artifacting produced extra colors beyond the nominal palette. He argues CGA looked better in period than it does on RGB monitors.
 30:55
[JSConfUS 2013] Steven Wittens: Making WebGL Dance
56K views • 13 years ago
JSConf
Steven Wittens' JSConf US 2013 talk on drawing with WebGL, using animated visuals to walk through vectors, matrices and the rendering pipeline. Despite the title, it works as a visual primer on the linear algebra behind 3D graphics.
 11:47
!!Con 2017: HDR Photography in Microsoft Excel?! by Kevin Chen
119K views • 9 years ago
Confreaks
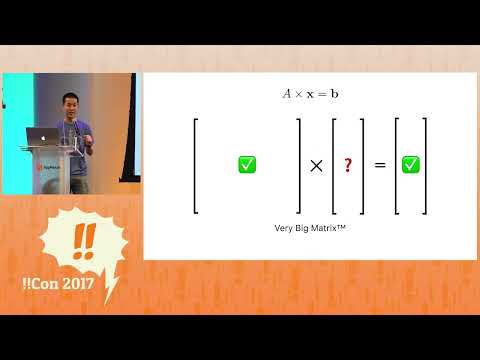
A short conference talk from !!Con 2017 in which Kevin Chen explains the HDR imaging algorithm from a foundational paper, framing it as a system of linear equations, and implements it in a Microsoft Excel spreadsheet. No prior image processing knowledge is needed.
 11:52
The Extreme Physics Pushing Moore’s Law to the Next Level
4.6M views • 7 years ago
Seeker
Seeker's Focal Point short documentary on ASML's extreme ultraviolet lithography machines, which make the most advanced chips. It shows how plasma-generated 13.5 nm light is used to push Moore's Law forward.
 12:04
Anagrams, but where you can break apart letters: "Anagraphs"
256K views • 8 years ago
suckerpinch
Tom Scott-style exploration by suckerpinch (Tom7) of generalized anagrams where letters can be broken into pieces, called anagraphs, with a whimsical computational approach.
 11:01
The Power of Big Data and Psychographics | 2016 Concordia Annual Summit
733K views • 10 years ago
Concordia
Alexander Nix of Cambridge Analytica presents at the 2016 Concordia Summit on using big data, psychographic profiling and behavioral microtargeting in elections.
 11:10
I could hardly believe my eyes! - Looking Glass Holographic Monitor
1.8M views • 6 years ago
Linus Tech Tips
Linus Tech Tips reviews the Looking Glass 8K holographic display, a glasses-free 3D monitor. The video shows the display in action and explains how it works.
 35:45
RAAIS 2017 - Simon Knowles, Co-Founder and CTO of Graphcore
7K views • 9 years ago
The Research and Applied AI Summit - RAAIS
Simon Knowles, co-founder and CTO of Graphcore, talks about "intelligence processors", chips designed specifically for machine learning. The talk was given at the RAAIS 2017 summit and covers Graphcore's architecture.
 2:12
3D Gaussian Splatting - Why Graphics Will Never Be The Same
2M views • 3 years ago
IndividualKex
A two-minute explainer of 3D Gaussian Splatting, the rendering technique from a 2023 research paper. It outlines why it could change how 3D graphics are made.
 7:08
How "oldschool" graphics worked Part 1 - Commodore and Nintendo
5.7M views • 11 years ago
The 8-Bit Guy
The 8-Bit Guy explains the color limitations of 1980s computers and consoles such as the NES and Commodore 64. It shows how sprites, attributes and palettes shaped the look of old games.