protein visualization
 3:04
mRNA Translation (Advanced)
1.5M views • 16 years ago
DNA Learning Center
A short animation from the DNA Learning Center showing how mRNA carries a gene's message to the ribosome, where tRNA and codons are used to assemble amino acids into a protein.
 24:52
AlphaFold - The Most Useful Thing AI Has Ever Done
11M views • 1 year ago
Veritasium
A Veritasium video on AlphaFold, DeepMind's protein structure prediction system, and the protein design work it enabled. It features interviews with John Jumper and with David Baker's protein design group and explains why predicting protein folding matters.
 11:33
A new way to visualize General Relativity
3.6M views • 6 years ago
ScienceClic English
ScienceClic explains why the rubber sheet analogy for general relativity is misleading and offers a new visualization that includes the curvature of time and shows gravity as motion through curved spacetime.
 14:34
Visualization of Quantum Physics (Quantum Mechanics)
2.8M views • 9 years ago
udiprod
An animated visualization of basic quantum mechanics using a free particle, with simulations based on the actual equations. It covers waves, particles, and how measurement collapses the wavefunction.
 6:08
Immigration, World Poverty and Gumballs
6.8M views • 16 years ago
NumbersUSA
Roy Beck's short gumball presentation using World Bank and Census data to argue that letting people immigrate to the US cannot solve world poverty because the numbers are so large. It is made by NumbersUSA, an immigration-restriction advocacy group.
 25:13
Thinking outside the 10-dimensional box
3.2M views • 9 years ago
3Blue1Brown
3Blue1Brown visualizes high-dimensional spheres to explain a surprising puzzle about how a sphere fits in a box as dimensions grow. It builds geometric intuition for counterintuitive properties of high-dimensional space.
 22:11
But what is the Riemann zeta function? Visualizing analytic continuation
5.4M views • 9 years ago
3Blue1Brown
3Blue1Brown visualizes the Riemann zeta function and the analytic continuation that extends it beyond where its series converges, building toward the Riemann hypothesis.
 12:20
I Solved Klotski
2.1M views • 1 year ago
2swap
2swap explains how he solved the Klotski sliding-block puzzle by mapping its full state space as a graph and visualizing it. The video includes footage of the Guinness world-record solve and links to an interactive graph.
 15:53
Quantum Field Theory visualized
2.7M views • 6 years ago
ScienceClic English
ScienceClic gives a 15-minute animated introduction to quantum field theory, covering fields, spin, conserved quantities, the standard model and interactions.
 21:25
Outside In
11.7M views • 15 years ago
ssgelm
A 21-minute animation showing how a sphere can be turned inside out without creases or tears, known as sphere eversion.
 18:40
But what is a neural network? | Deep learning chapter 1
25.1M views • 9 years ago
3Blue1Brown
3Blue1Brown's first chapter on deep learning explains what neurons and layers are and the math underlying a basic neural network, using handwritten digit recognition with visual animations.
 24:26
The Beauty of Bézier Curves
2.2M views • 5 years ago
Freya Holmér
Freya Holmer explains how Bezier curves work, from the helper-line construction to their uses in animation, text rendering and shapes. It uses visuals from her Unity Shapes plugin and was a SoME1 contest winner.
 1:13:50
The Continuity of Splines
1.9M views • 3 years ago
Freya Holmér
Freya Holmer's 74-minute video essay on splines, covering Bezier curves, B-splines, derivatives and the different levels of continuity (C0, C1, C2), built with custom animation tools. She notes she did not cover non-uniform splines.
 4:48
Hans Rosling's 200 Countries, 200 Years, 4 Minutes - The Joy of Stats - BBC
11.5M views • 15 years ago
BBC
Hans Rosling uses augmented-reality animation to show 200 countries over 200 years in four minutes, built from 120,000 data points. It tracks life expectancy and income to show the world's development.
 27:14
Transformers, the tech behind LLMs | Deep Learning Chapter 5
11.6M views • 2 years ago
3Blue1Brown
3Blue1Brown's visual explanation of how transformers and GPT-style language models work, tracing data through tokens, embeddings and attention.
 44:23
A Swift Introduction to Geometric Algebra
1.1M views • 6 years ago
sudgylacmoe
An animated introduction to geometric algebra, presented as a language that can describe most of physics. It was made with manim and covers multivectors and how they generalize familiar tools like cross products and quaternions.
 31:51
Visualizing the 4d numbers Quaternions
5.6M views • 8 years ago
3Blue1Brown
3Blue1Brown builds visual intuition for quaternions, showing how to think about this four-dimensional number system using stereographic projection and rotations in 3D space. It is part one of a two-part series with an interactive companion site.
 6:51
Star Size Comparison 2
48.7M views • 10 years ago
morn1415
A visual scale comparison of stars and cosmic objects, from planets up to some of the largest known stars, set to music. It is meant to convey the vastness of the universe.
 26:10
Attention in transformers, step-by-step | Deep Learning Chapter 6
4.8M views • 2 years ago
3Blue1Brown
3Blue1Brown's visual walkthrough of the attention mechanism inside transformers, covering self-attention, multiple heads and cross-attention. It is chapter 6 of his deep learning series.
 24:47
But what is a Fourier series? From heat flow to drawing with circles | DE4
19M views • 7 years ago
3Blue1Brown
3Blue1Brown introduces Fourier series, from the heat equation to drawing arbitrary shapes with rotating circles. It builds a visual intuition for decomposing functions into sine waves.
 18:18
Hilbert's Curve: Is infinite math useful?
2.4M views • 9 years ago
3Blue1Brown
3Blue1Brown explains space-filling curves and the Hilbert curve, and how infinite mathematical constructions connect to finite, practical approximations. It touches on mapping between dimensions and sensory ideas.
 4:08
e^(iπ) in 3.14 minutes, using dynamics | DE5
3.4M views • 7 years ago
3Blue1Brown
A short 3Blue1Brown video explaining Euler's formula e^(i*pi) = -1 through dynamics, treating velocity as the thing that moves a point to a new position. It builds geometric intuition for why an exponent with i produces rotation.
 57:03
HACKENBUSH: a window to a new world of math
562K views • 5 years ago
Owen Maitzen
Owen Maitzen's animated hour-long introduction to Hackenbush, a simple combinatorial game, and how its strategy leads to surreal numbers and the roots of the number system.
 1:19:08
A Million Dollars vs A Billion Dollars, Visualized: A Road Trip
8.3M views • 6 years ago
Tom Scott
Tom Scott makes the difference between a million and a billion dollars tangible by using distance on a road trip instead of volume. The drive makes the scale of a billion intuitively felt.
 4:01
Spherical Geometry Is Stranger Than Hyperbolic - Hyperbolica Devlog #2
1.8M views • 6 years ago
CodeParade
CodeParade's short devlog on how spherical geometry looks in 2D and 3D and why it feels so unusual, part of the Hyperbolica series on a non-Euclidean game.
 4:17
The Hubble Ultra Deep Field in 3D
9.6M views • 17 years ago
Deep Astronomy
A short video built around an animation of the roughly 10,000 galaxies in the Hubble Ultra Deep Field, placed at their measured redshift distances. It gives a brief history of deep field images and ends with a 3D fly-through.
 11:57
We all move at the Speed of Light
1.4M views • 7 years ago
ScienceClic English
ScienceClic explains why nothing can go faster than light by treating motion through space and time together, so everything moves at the speed of light through spacetime. It uses animated visuals to cover relativity basics in 12 minutes.
 14:53
What would we see if we fell into a Black Hole?
7.5M views • 5 years ago
ScienceClic English
ScienceClic visualizes what you would see falling into a black hole, from the approach and the accretion disc to crossing the horizon, in 15 minutes.
 28:28
What is PLUS times PLUS?
2.2M views • 1 year ago
2swap
2swap explores lambda calculus using John Tromp's lambda diagrams, with animated beta-reductions, asking what PLUS times PLUS gives. It touches on Church encodings and the equivalence of Turing machines and lambda calculus.
 4:59
ATP synthase in action
1.8M views • 9 years ago
Harvard Online
A short Harvard Online animation, narrated by Professor Rob Lue, showing how ATP synthase works inside mitochondria. It comes from the HarvardX Cell Biology: Mitochondria course.
 6:47
Starlink revisions, Nov 2018
173K views • 7 years ago
Mark Handley
Mark Handley of UCL looks at how SpaceX's November 2018 revisions to the Starlink constellation affect network behavior. The video visualizes the orbits and routing and estimates latencies, building on his earlier video and research paper.
 12:44
Rapping, deconstructed: The best rhymers of all time
16.3M views • 10 years ago
Vox
Vox breaks down how great rappers build rhymes, from Kurtis Blow's simple bars to Biggie's smooth flow and Kendrick Lamar's dense, fast delivery. It uses on-screen visualizations of rhyme structure.
 11:33
Light Waves Visualized using Photon Sieves.
69K views • 6 years ago
Huygens Optics
Huygens Optics shows how DIY photon sieves shape a laser's wave front, explaining how they differ from zone plates and how aperture count affects the focal point, with time-resolved visualizations of the diffraction.
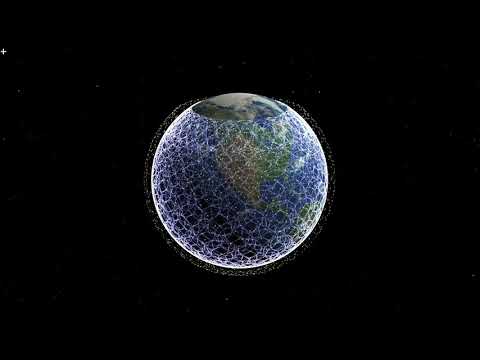 10:15
Using ground relays with Starlink
506K views • 6 years ago
Mark Handley
Mark Handley of UCL explains, with simulation visualizations, how early Starlink satellites without inter-satellite links could still give low-latency wide-area communication by hopping via ground relays. He shows it can beat fibre on many long paths.
 13:38
Why Japan had NO Chance in WW2
835K views • 7 years ago
Military History Visualized
Military History Visualized charts ship production by the United States and Japan from December 1941 to September 1945. The growing numbers show why Japan, despite a stronger starting navy, could not win a long war.
 6:21
Your Body's Molecular Machines
5.1M views • 8 years ago
Veritasium
Veritasium short showing Drew Berry's scientifically accurate animations of the molecular machines that drive cell division. It walks through mitosis, chromosomes and motor proteins.
 5:13
Overview of Illumina Sequencing by Synthesis Workflow | Standard SBS chemistry
2.7M views • 10 years ago
Illumina
Illumina's 3D animation of its sequencing-by-synthesis workflow, from sample preparation and cluster generation to sequencing on a flow cell and data analysis.
 14:20
Reveal Invisible Motion With This Clever Video Trick
2.8M views • 6 years ago
Steve Mould
Steve Mould explains motion amplification and video magnification, techniques that find tiny changes in video invisible to the eye and exaggerate them. He covers the MIT research and industrial uses such as diagnosing vibrating machinery.