visualization
 14:34
Visualization of Quantum Physics (Quantum Mechanics)
2.8M views • 9 years ago
udiprod
An animated visualization of basic quantum mechanics using a free particle, with simulations based on the actual equations. It covers waves, particles, and how measurement collapses the wavefunction.
 6:08
Immigration, World Poverty and Gumballs
6.8M views • 16 years ago
NumbersUSA
Roy Beck's short gumball presentation using World Bank and Census data to argue that letting people immigrate to the US cannot solve world poverty because the numbers are so large. It is made by NumbersUSA, an immigration-restriction advocacy group.
Topic match · Data visualization & information design 12:20
I Solved Klotski
2.1M views • 1 year ago
2swap
2swap explains how he solved the Klotski sliding-block puzzle by mapping its full state space as a graph and visualizing it. The video includes footage of the Guinness world-record solve and links to an interactive graph.
Topic match · Data visualization & information design 4:48
Hans Rosling's 200 Countries, 200 Years, 4 Minutes - The Joy of Stats - BBC
11.5M views • 15 years ago
BBC
Hans Rosling uses augmented-reality animation to show 200 countries over 200 years in four minutes, built from 120,000 data points. It tracks life expectancy and income to show the world's development.
Topic match · Data visualization & information design 6:51
Star Size Comparison 2
48.7M views • 10 years ago
morn1415
A visual scale comparison of stars and cosmic objects, from planets up to some of the largest known stars, set to music. It is meant to convey the vastness of the universe.
Topic match · Data visualization & information design 4:17
The Hubble Ultra Deep Field in 3D
9.6M views • 17 years ago
Deep Astronomy
A short video built around an animation of the roughly 10,000 galaxies in the Hubble Ultra Deep Field, placed at their measured redshift distances. It gives a brief history of deep field images and ends with a 3D fly-through.
Topic match · Data visualization & information design 6:24
Wealth Inequality in America
26.7M views • 13 years ago
politizane
A short infographic video on the distribution of wealth in America, contrasting what people believe, what they consider ideal, and the actual numbers. It highlights how top-heavy US wealth is.
Topic match · Data visualization & information design 11:33
A new way to visualize General Relativity
3.6M views • 6 years ago
ScienceClic English
ScienceClic explains why the rubber sheet analogy for general relativity is misleading and offers a new visualization that includes the curvature of time and shows gravity as motion through curved spacetime.
 6:18
Animated Voting Methods
16K views • 9 years ago
Unify The Vote
An animated simulation comparing single-winner voting methods such as plurality, instant runoff and STAR. Colored regions show which candidate wins as a randomized electorate shifts across a two-dimensional political space, building on Ka-Ping Yee's earlier diagrams.
Topic match · Data visualization & information design 6:40
Overpopulation – The Human Explosion Explained
14M views • 9 years ago
Kurzgesagt – In a Nutshell
A Kurzgesagt explainer on why the human population exploded and why growth is slowing, drawing on Our World in Data. It argues that birth rates fall as countries develop, easing overpopulation fears.
Topic match · Data visualization & information design 8:33
Drawing Conclusions: Is renting really a waste of money?
5.4M views • 11 years ago
The Globe and Mail
A short Globe and Mail animated explainer on why renting can leave you as well off as buying a home. It walks through a rent-versus-buy comparison using Toronto numbers and the opportunity cost of a down payment. The video notes it dates from 2015 and the housing market has changed since.
Topic match · Data visualization & information design 8:09
Google Earth’s Incredible 3D Imagery, Explained
3.1M views • 9 years ago
Nat and Friends
A short explainer from Nat and Friends on where Google Earth's 3D imagery comes from, how it is stitched together, and how often it is updated. It describes aircraft carrying camera rigs and photogrammetry that turns the photos into 3D models.
Topic match · Data visualization & information design 11:45
The History of Europe: Every Year
33.9M views • 8 years ago
Cottereau
An animated map showing the borders and populations of European countries for every year since 400 BC. Vassal states and colonies are excluded from population counts.
Topic match · Data visualization & information design 11:24
The Tube Map nearly looked very different
2.6M views • 4 years ago
Map Men
Map Men's Jay Foreman tells the story of how the London Tube map nearly looked very different, including Harry Beck's design and TfL's initial rejection of it. A short, witty history of a design icon.
Topic match · Data visualization & information design 15:53
Quantum Field Theory visualized
2.7M views • 6 years ago
ScienceClic English
ScienceClic gives a 15-minute animated introduction to quantum field theory, covering fields, spin, conserved quantities, the standard model and interactions.
 18:40
But what is a neural network? | Deep learning chapter 1
25.1M views • 9 years ago
3Blue1Brown
3Blue1Brown's first chapter on deep learning explains what neurons and layers are and the math underlying a basic neural network, using handwritten digit recognition with visual animations.
 18:18
Hilbert's Curve: Is infinite math useful?
2.4M views • 9 years ago
3Blue1Brown
3Blue1Brown explains space-filling curves and the Hilbert curve, and how infinite mathematical constructions connect to finite, practical approximations. It touches on mapping between dimensions and sensory ideas.
 4:08
e^(iπ) in 3.14 minutes, using dynamics | DE5
3.4M views • 7 years ago
3Blue1Brown
A short 3Blue1Brown video explaining Euler's formula e^(i*pi) = -1 through dynamics, treating velocity as the thing that moves a point to a new position. It builds geometric intuition for why an exponent with i produces rotation.
 4:01
Spherical Geometry Is Stranger Than Hyperbolic - Hyperbolica Devlog #2
1.8M views • 6 years ago
CodeParade
CodeParade's short devlog on how spherical geometry looks in 2D and 3D and why it feels so unusual, part of the Hyperbolica series on a non-Euclidean game.
 11:57
We all move at the Speed of Light
1.4M views • 7 years ago
ScienceClic English
ScienceClic explains why nothing can go faster than light by treating motion through space and time together, so everything moves at the speed of light through spacetime. It uses animated visuals to cover relativity basics in 12 minutes.
 14:53
What would we see if we fell into a Black Hole?
7.5M views • 5 years ago
ScienceClic English
ScienceClic visualizes what you would see falling into a black hole, from the approach and the accretion disc to crossing the horizon, in 15 minutes.
 6:47
Starlink revisions, Nov 2018
173K views • 7 years ago
Mark Handley
Mark Handley of UCL looks at how SpaceX's November 2018 revisions to the Starlink constellation affect network behavior. The video visualizes the orbits and routing and estimates latencies, building on his earlier video and research paper.
 12:44
Rapping, deconstructed: The best rhymers of all time
16.3M views • 10 years ago
Vox
Vox breaks down how great rappers build rhymes, from Kurtis Blow's simple bars to Biggie's smooth flow and Kendrick Lamar's dense, fast delivery. It uses on-screen visualizations of rhyme structure.
 11:33
Light Waves Visualized using Photon Sieves.
69K views • 6 years ago
Huygens Optics
Huygens Optics shows how DIY photon sieves shape a laser's wave front, explaining how they differ from zone plates and how aperture count affects the focal point, with time-resolved visualizations of the diffraction.
 10:15
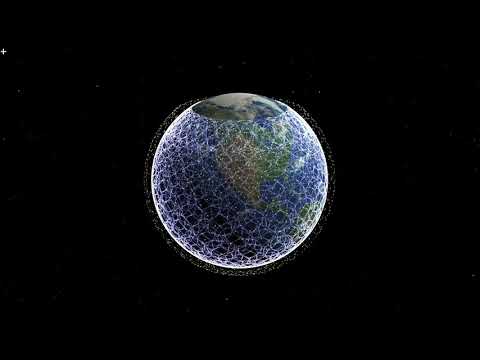
Using ground relays with Starlink
506K views • 6 years ago
Mark Handley
Mark Handley of UCL explains, with simulation visualizations, how early Starlink satellites without inter-satellite links could still give low-latency wide-area communication by hopping via ground relays. He shows it can beat fibre on many long paths.
 13:38
Why Japan had NO Chance in WW2
835K views • 7 years ago
Military History Visualized
Military History Visualized charts ship production by the United States and Japan from December 1941 to September 1945. The growing numbers show why Japan, despite a stronger starting navy, could not win a long war.
 5:13
Overview of Illumina Sequencing by Synthesis Workflow | Standard SBS chemistry
2.7M views • 10 years ago
Illumina
Illumina's 3D animation of its sequencing-by-synthesis workflow, from sample preparation and cluster generation to sequencing on a flow cell and data analysis.
 4:59
ATP synthase in action
1.8M views • 9 years ago
Harvard Online
A short Harvard Online animation, narrated by Professor Rob Lue, showing how ATP synthase works inside mitochondria. It comes from the HarvardX Cell Biology: Mitochondria course.
 14:20
Reveal Invisible Motion With This Clever Video Trick
2.8M views • 6 years ago
Steve Mould
Steve Mould explains motion amplification and video magnification, techniques that find tiny changes in video invisible to the eye and exaggerate them. He covers the MIT research and industrial uses such as diagnosing vibrating machinery.