visual programming
 11:33
A new way to visualize General Relativity
3.6M views • 6 years ago
ScienceClic English
ScienceClic explains why the rubber sheet analogy for general relativity is misleading and offers a new visualization that includes the curvature of time and shows gravity as motion through curved spacetime.
 8:00
Edgar Wright - How to Do Visual Comedy
11.4M views • 12 years ago
Every Frame a Painting
An Every Frame a Painting video essay analysing how Edgar Wright creates visual comedy through framing, camera movement, editing, sound effects and music.
 19:42
But what is the Fourier Transform? A visual introduction.
12.6M views • 8 years ago
3Blue1Brown
3Blue1Brown's animated visual introduction to the Fourier Transform, showing how a signal breaks into frequency components.
 15:53
Quantum Field Theory visualized
2.7M views • 6 years ago
ScienceClic English
ScienceClic gives a 15-minute animated introduction to quantum field theory, covering fields, spin, conserved quantities, the standard model and interactions.
 14:34
Visualization of Quantum Physics (Quantum Mechanics)
2.8M views • 9 years ago
udiprod
An animated visualization of basic quantum mechanics using a free particle, with simulations based on the actual equations. It covers waves, particles, and how measurement collapses the wavefunction.
 6:51
Star Size Comparison 2
48.7M views • 10 years ago
morn1415
A visual scale comparison of stars and cosmic objects, from planets up to some of the largest known stars, set to music. It is meant to convey the vastness of the universe.
 11:33
Light Waves Visualized using Photon Sieves.
69K views • 6 years ago
Huygens Optics
Huygens Optics shows how DIY photon sieves shape a laser's wave front, explaining how they differ from zone plates and how aperture count affects the focal point, with time-resolved visualizations of the diffraction.
 8:35
Buster Keaton - The Art of the Gag
8.4M views • 10 years ago
Every Frame a Painting
An Every Frame a Painting video essay on Buster Keaton's visual comedy, examining how he built and framed his gags. It uses clips from his silent films to show the thinking behind them.
 12:20
I Solved Klotski
2.1M views • 1 year ago
2swap
2swap explains how he solved the Klotski sliding-block puzzle by mapping its full state space as a graph and visualizing it. The video includes footage of the Guinness world-record solve and links to an interactive graph.
 14:53
What would we see if we fell into a Black Hole?
7.5M views • 5 years ago
ScienceClic English
ScienceClic visualizes what you would see falling into a black hole, from the approach and the accretion disc to crossing the horizon, in 15 minutes.
 13:38
Why Japan had NO Chance in WW2
835K views • 7 years ago
Military History Visualized
Military History Visualized charts ship production by the United States and Japan from December 1941 to September 1945. The growing numbers show why Japan, despite a stronger starting navy, could not win a long war.
 18:40
But what is a neural network? | Deep learning chapter 1
25.1M views • 9 years ago
3Blue1Brown
3Blue1Brown's first chapter on deep learning explains what neurons and layers are and the math underlying a basic neural network, using handwritten digit recognition with visual animations.
 11:15
The hardest problem on the hardest test
16.5M views • 8 years ago
3Blue1Brown
3Blue1Brown walks through a very hard Putnam competition problem and its elegant solution, emphasizing the visual intuition and the thought process behind solving it.
 6:08
Immigration, World Poverty and Gumballs
6.8M views • 16 years ago
NumbersUSA
Roy Beck's short gumball presentation using World Bank and Census data to argue that letting people immigrate to the US cannot solve world poverty because the numbers are so large. It is made by NumbersUSA, an immigration-restriction advocacy group.
 17:16
Eigenvectors and eigenvalues | Chapter 14, Essence of linear algebra
6.4M views • 10 years ago
3Blue1Brown
3Blue1Brown's chapter on eigenvectors and eigenvalues in the Essence of Linear Algebra series. It builds a visual intuition for what they mean, why an eigenbasis is useful, and ends with a puzzle.
 18:18
Hilbert's Curve: Is infinite math useful?
2.4M views • 9 years ago
3Blue1Brown
3Blue1Brown explains space-filling curves and the Hilbert curve, and how infinite mathematical constructions connect to finite, practical approximations. It touches on mapping between dimensions and sensory ideas.
 4:08
e^(iπ) in 3.14 minutes, using dynamics | DE5
3.4M views • 7 years ago
3Blue1Brown
A short 3Blue1Brown video explaining Euler's formula e^(i*pi) = -1 through dynamics, treating velocity as the thing that moves a point to a new position. It builds geometric intuition for why an exponent with i produces rotation.
 12:47
Backpropagation, intuitively | Deep Learning Chapter 3
6.4M views • 9 years ago
3Blue1Brown
3Blue1Brown's third deep learning chapter gives a visual, intuitive account of backpropagation and what happens to a neural network as it learns. A follow-up video covers the underlying calculus.
 4:01
Spherical Geometry Is Stranger Than Hyperbolic - Hyperbolica Devlog #2
1.8M views • 6 years ago
CodeParade
CodeParade's short devlog on how spherical geometry looks in 2D and 3D and why it feels so unusual, part of the Hyperbolica series on a non-Euclidean game.
 10:45
Back to the Future | VFXcool (1/2)
2.2M views • 9 years ago
Captain Disillusion
Captain Disillusion explains the visual effects behind the Back to the Future trilogy. He covers ILM's motion-control, computer-controlled camera work and clever pre-CGI tricks.
 11:57
We all move at the Speed of Light
1.4M views • 7 years ago
ScienceClic English
ScienceClic explains why nothing can go faster than light by treating motion through space and time together, so everything moves at the speed of light through spacetime. It uses animated visuals to cover relativity basics in 12 minutes.
 4:48
Hans Rosling's 200 Countries, 200 Years, 4 Minutes - The Joy of Stats - BBC
11.5M views • 15 years ago
BBC
Hans Rosling uses augmented-reality animation to show 200 countries over 200 years in four minutes, built from 120,000 data points. It tracks life expectancy and income to show the world's development.
 10:13
The Problem with Time & Timezones - Computerphile
4.4M views • 12 years ago
Computerphile
Tom Scott explains for Computerphile why handling time and timezones in code is so hard, walking through a simple web app that computes how long ago something happened. It covers the quirks of timezones and calendars and ends in an exasperated rant.
 16:30
"NO CGI" is really just INVISIBLE CGI - 1
1.5M views • 3 years ago
The Movie Rabbit Hole
VFX supervisor Jonas Ussing examines what studios mean by "no CGI", showing how much invisible CGI hides behind practical-effects marketing. It is the first part of a multi-part series that includes analysis of doctored behind-the-scenes footage.
 14:27
The Biggest Myth In Education
15.5M views • 5 years ago
Veritasium
Veritasium debunks the idea of learning styles, such as being a visual learner, with an interview with Daniel Willingham and a memory experiment. It argues that a multimodal approach helps everyone.
 13:36
Chinese Invisibility Cloak Hoax DESTROYED!!!
6.8M views • 8 years ago
Captain Disillusion
Captain Disillusion debunks a viral Chinese invisibility cloak video while parodying popular educational channels. Along the way he explains chroma keying and green screen techniques.
 7:00
CD / Color
2.9M views • 6 years ago
Captain Disillusion
Captain Disillusion's comedic, fast-paced explainer on how color works in cameras, displays and video. It covers the biology of color perception and what it means for screens.
 6:47
Starlink revisions, Nov 2018
173K views • 7 years ago
Mark Handley
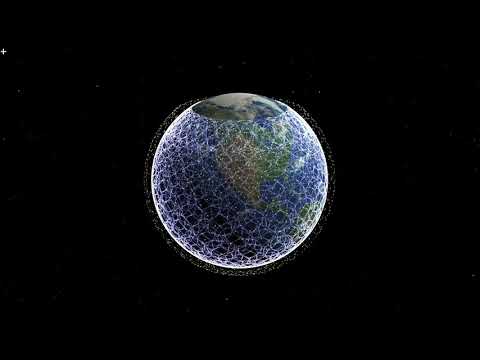
Mark Handley of UCL looks at how SpaceX's November 2018 revisions to the Starlink constellation affect network behavior. The video visualizes the orbits and routing and estimates latencies, building on his earlier video and research paper.
 19:25
New computers don't speed up old code
187K views • 1 year ago
Matthias random stuff
Matthias Wandel tests old and new code on a range of PCs, including a new mini PC, to measure how much faster modern hardware really is. He also shows optimization techniques such as branchless code, with benchmark programs on GitHub.
 10:15
Using ground relays with Starlink
506K views • 6 years ago
Mark Handley
Mark Handley of UCL explains, with simulation visualizations, how early Starlink satellites without inter-satellite links could still give low-latency wide-area communication by hopping via ground relays. He shows it can beat fibre on many long paths.
 15:11
Bayes theorem, the geometry of changing beliefs
6M views • 6 years ago
3Blue1Brown
3Blue1Brown presents Bayes' theorem through a geometric diagram, showing how evidence should update beliefs. It works through the Kahneman and Tversky style questions and base rates.
 4:17
The Hubble Ultra Deep Field in 3D
9.6M views • 17 years ago
Deep Astronomy
A short video built around an animation of the roughly 10,000 galaxies in the Hubble Ultra Deep Field, placed at their measured redshift distances. It gives a brief history of deep field images and ends with a 3D fly-through.
 16:43
The Equation That Explains (Nearly) Everything!
1.6M views • 4 years ago
PBS Space Time
PBS Space Time explains the Standard Model Lagrangian, the single equation encapsulating the particle physics theory, and visualizes what its terms mean.
 6:24
Wealth Inequality in America
26.7M views • 13 years ago
politizane
A short infographic video on the distribution of wealth in America, contrasting what people believe, what they consider ideal, and the actual numbers. It highlights how top-heavy US wealth is.
 10:03
The determinant | Chapter 6, Essence of linear algebra
5M views • 10 years ago
3Blue1Brown
A 10-minute 3Blue1Brown chapter explaining the determinant as the factor by which a linear transformation scales area or volume. It builds the idea geometrically with animations before any formulas.
 18:07
The more general uncertainty principle, regarding Fourier transforms
2.3M views • 8 years ago
3Blue1Brown
3Blue1Brown shows how the uncertainty principle arises from Fourier transforms. A wave packet cannot be narrow in both position and frequency, so the principle is a property of waves rather than of measurement.
 15:08
What does it feel like to invent math?
4.6M views • 11 years ago
3Blue1Brown
3Blue1Brown explores infinite sums from convergent to divergent, with an introduction to the 2-adic metric, themed on the cycle between discovering and inventing mathematics.
 7:42
Triangle of Power
812K views • 10 years ago
3Blue1Brown
3Blue1Brown presents the Triangle of Power, an alternate notation that unifies powers, logarithms and roots in a single triangular symbol. The video shows how the inverse operations relate and how the notation could help.
 6:18
Animated Voting Methods
16K views • 9 years ago
Unify The Vote
An animated simulation comparing single-winner voting methods such as plurality, instant runoff and STAR. Colored regions show which candidate wins as a randomized electorate shifts across a two-dimensional political space, building on Ka-Ping Yee's earlier diagrams.
 6:42
Carl Sagan - Cosmos - Eratosthenes
3M views • 17 years ago
carlsagandotcom
A short clip from Carl Sagan's Cosmos in which he explains how Eratosthenes measured the circumference of the Earth using shadows in two Egyptian cities. It is a clear, visual account of an ancient scientific feat.